GLASER CONSULTING LTD
Business Analysis & Strategy
Markets • Product Lines • Sales 

 
Do you have questions about the charts on this page? 

CLICK HERE  to send us an email.
BROAD PRODUCT LINE + LOTS OF CUSTOMERS = COMPLEXITY

Complexity buries growth and improvement opportunities
Not all customers are equal or have the same impact on a business. The same is true for products. Not all customers are equal or have the same impact on a business. The same is true for products. Not all customers are equal or have the same impact on a business. The same is true for products. If the mix of customers and products is limited, understanding where to focus for growth and improvement is relatively simple.  If the mix is large and diverse, it is anything but simple.
A business with lots of products and lots of customers is complex. Such businesses all have hidden opportunities to drive growth or improve financial performance. Finding them is the challenge. 

The biggest customers and products will always get attention--rightly so--while opportunities buried by complexity typically go unnoticed. Out of sight, out of mind. A business can not deal with what it is unaware of.  

Even when a business suspects hidden opportunities exist, without specific and detailed insight, it can only take broad brush actions to address them: across the board price increases or decreases, blanket product rationalizations or customer eliminations are some examples. These are crude actions that don't always produce the results they were intended to. Often, they have negative unintended consequences. The best way to address opportunities hidden by complexity without unwanted collateral damage is to: 1) uncover them, 2) thoroughly understand the details and 3) take specific, precise actions.

Analyzing customers or products (or markets, regions, etc.) by grouping them into classes provides "one-dimensional" insight that is useful. It is a common and obvious first step. Most analysis stop here. Going further, however, and analyzing customer-product combinations provides "multi-dimensional" insights that reveal non-obvious opportunities.  These can be acted on with precision.

The charts that follow illustrate how grouping customers and products and analyzing customer-product combinations can uncover growth and improvement opportunities in a complex business. These examples are taken from a real specialty business that, on average, had good margins to start with.
t all customers are equal or have the same impact on a business. The same is true for products. If the mix of customers and products is limited, understanding where to focus for growth and improvement is relatively simple.  If the mix is large and diverse, it is anything but simple.Not all customers are equal or have the same impact on a business. The same is true for products. If the mix of customers and products is limited, understanding where to focus for growth and improvement is relatively simple.  If the mix is large and diverse, it is anything but simple
Not all customers are equal or have the same impact on a business. The same is true for products. If the mix of customers and products is limited, understanding where to focus for growth and improvement is relatively simple.  If the mix is large and diverse, it is anything but simple.
A large product line can be the source of significant buried costs: extra inventory, raw materials, packaging, labels, as well as sub-optimal production scheduling.

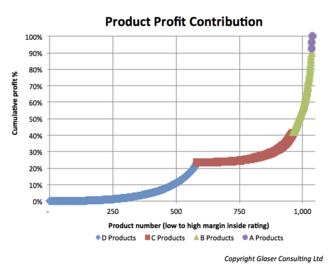
The chart on the right shows the profit contribution by product for a specialty company with over 1,000 SKUs. It shows a long tail of low profit products.

Yet, while the majority of profits come from the top products (the bottom 900 generate less than 40%), there are significant profit contributors in the tail ("D" & "C" groups).

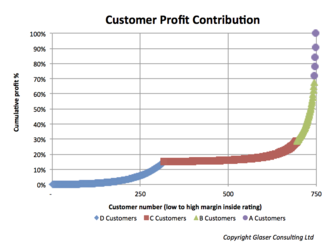
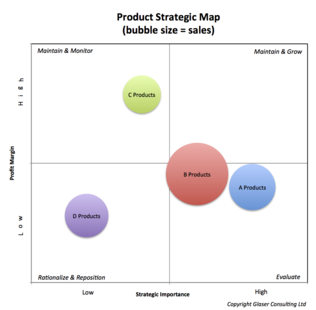
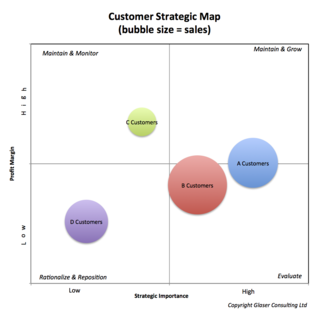
Culling the bottom "D" and "C" products is a starting point, but would be overly simplistic. What type of customers are buying them? Who would be impacted?
A large collection of small volume customers can also add significant hidden costs to a business. Servicing small customers can be expensive.

The chart on the right shows the relative profit contribution for the 750 customers of the same specialty company.

The bottom 600 generate less than 20% of the profit, but there are customers in both the "D" and "C" groups that are positive contributors. Who are they? What type of products do they buy?

Eliminating small customers to reduce service costs might seem easy, but could compromise future growth if done without proper consideration.
Charting product and customer groups on a 2x2 grid provides visual perspective and additional insight.

The chart on the right shows the product groups from the profit contribution chart on a map of profit margin vs. strategic importance.

"D" products look to be a clear target for rationalization, but it is not known who these products are sold to.

"C" products look interesting, are high margin and significant revenue and might contain targets for growth.

"A" & "B" products are suboptimal in margin, why?  Who buys these?

The chart on the right shows the customer groups from the profit contribution chart on a map of profit margin vs. strategic importance.

"D" customers are a clear target for rationalization or repositioning. Collectively, the sales are significant--what products are they buying?

"C" customers are a small but profitable group of sales, what can be leveraged?

"B" customers are collectively suboptimal in margin--why?  What products are they buying?
The chart on the right shows the customer-product groups on a map of profit margin vs. strategic importance.

Looking at customer-product groups focusses the drill-down to specific products & customers for improvement or growth.

In this case, "D" customers buying "D" products are "low risk" for pricing actions or rationalization.

"B" customers buying "D" products are a clear pricing or product substitution opportunity benchmarked to "A" customers.

"D" customers buying "C" products are an interesting set because of their size and profitability--this should contain growth opportunities.
What opportunities did these charts lead to for the specialty company studied?  
 
 A combination of several discreet actions to improve profitability and one for growth:
  • Specific product and customer pricing actions to improve margins
  • Specific product replacements with lower cost alternatives
  • Rationalization of a specific set of low performing products sold to low margin customers
  • Uncovering the details behind high margin sales to historically non-strategic customers and leveraging the learnings to grow

Every company has a unique customer-product mix, which makes every strategic map different.

What would your business' commercial strategic map look like?